It is rarely a disaster. It is an erosion.
Bad web development almost never announces itself. There is no morning where the site collapses and someone is fired. Instead there is a slow accumulation: a page that takes a little longer to load than it did last year, a form that fails for a certain browser, a mobile layout that shifts under the thumb, a checkout step that loses three percent of people for reasons nobody has investigated.
Because none of it is dramatic, none of it gets costed. The site is "fine." It is not fine — it is expensive, in three separate ledgers, and only one of them ever appears on an invoice.
The first ledger: the bill you can see
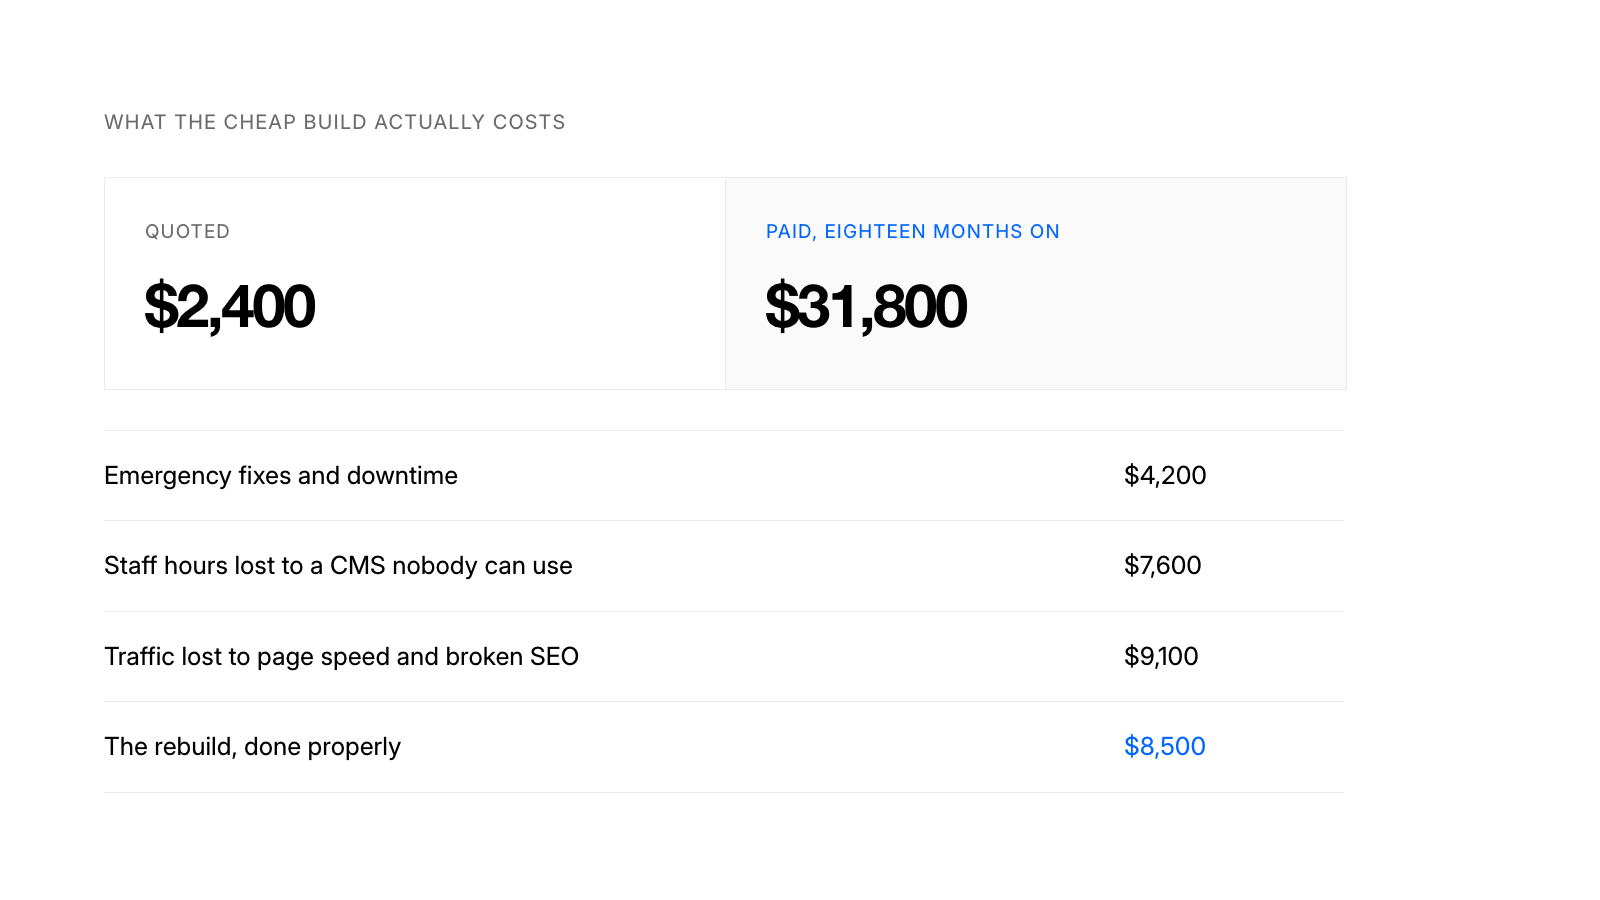
This is the one businesses recognise, usually in hindsight. You paid for a site. Three years later it cannot do what you need, so you pay for another one. Perhaps you paid twice in between for someone to fix what the last person built.
The visible cost is the rebuild cycle, and its real driver is almost never technology going out of date. HTML did not stop working. The site failed because it was built as a set of hand-made pages rather than a system — so adding the ninth service meant designing a ninth page, and the person who understood the layout has left.
The tell is simple and worth checking on your own site: can a non-technical person on your team publish a new service page today, unaided, and will it look right? If the answer is no, you are not paying for a website. You are paying rent on a dependency, and the rent goes up.
There is a second visible cost hiding here: the changes you never made. Not the tickets you filed — the ideas you abandoned because you knew what it would cost to get them live. That number does not appear anywhere in your accounts and is usually larger than everything that does.
The second ledger: the bill you inherit
The Consortium for Information & Software Quality put a figure on the aggregate. Their 2022 analysis estimated the cost of poor software quality in the United States at $2.41 trillion, of which roughly $1.52 trillion was accumulated technical debt — the cost of reworking software that was built suboptimally in the first place.1
Technical debt is a genuinely useful metaphor because it behaves like debt. You take it on deliberately or accidentally, it does not appear on the balance sheet, and it charges interest in the form of every future change costing more than it should. A shortcut in year one is a tax on years two through six.
On a marketing site it looks like this. Someone needed a landing page quickly, so styles were written inline. That worked. The next person copied that page as a starting point, because it was there. Two years later there are forty pages with inline styles, a brand refresh is proposed, and the quote comes back at four times what anyone expected. Nobody made a bad decision. The compounding made it expensive.
The CISQ report also notes that finding and fixing defects is the single largest expense in the software lifecycle. That is worth sitting with, because it inverts the usual instinct. The cheap part is building it properly. The expensive part is discovering later that it was not.
The third ledger: the bill someone else pays
The first two ledgers are yours. The third is not, which is exactly why it goes unexamined.
WebAIM's 2026 analysis of the top one million home pages found detectable WCAG failures on 95.9% of them — an average of 56.1 errors per page, and a reversal of several years of slow improvement.2 Six recurring problems account for 96% of all errors, and have done for seven consecutive years. Low-contrast text appeared on 83.9% of pages. Missing image alternatives on 53.1%. Missing form labels on 51%.
Translate those from compliance language into human terms. Missing form labels means a person using a screen reader reaches your contact form and cannot tell which box is the email address. Low contrast means someone with reduced vision — which, given ageing, eventually includes most of us — cannot read your pricing. Empty links, present on 46.3% of pages, mean a navigation item that announces itself as nothing at all.
These are not exotic engineering problems. They are a label element, a contrast ratio, and an alt attribute. They persist because they are invisible to the people who commissioned the site and no one was made responsible for them.
The legal system has begun pricing this in. Plaintiffs filed 3,117 federal web accessibility lawsuits in 2025, a 27% increase over the previous year, and more than 5,000 when state filings are included.3 Web accessibility claims now account for 36% of all ADA Title III federal filings, up from 28% the year before. More than 25,000 digital accessibility suits have been filed since 2018.
The detail worth noting: of the 5,000-plus filed in 2025, 1,427 targeted companies that had already been sued once for the same thing. They settled, did not fix the underlying build, and were sued again. That is the clearest possible illustration of the difference between treating accessibility as a legal exposure and treating it as a construction standard.
But the litigation is the least interesting part. The genuine cost is that roughly one in four adults has a disability, and a site with 56 errors on it has quietly decided which of them is welcome. That is the social bottom line: not a fine, but a set of people who were excluded by decisions nobody remembers making.
When careless becomes deliberate
There is a line past which bad development stops being negligence and becomes design intent, and it is worth naming because the same techniques are now sold as conversion optimisation.
Dark patterns — interfaces built to produce a decision the user would not otherwise make — are widespread. A European Commission study found deceptive patterns in 97% of the most popular apps and websites used by EU consumers, and academic crawls of thousands of shopping sites have found them routinely deployed at scale.4 Fake urgency, pre-ticked boxes, a cancellation flow six steps deep when signup was one.
Regulators have moved from statements to numbers. In September 2025, the FTC settled with Amazon for $2.5 billion over allegations that it used deceptive interface design to enrol consumers in Prime and then made cancellation deliberately difficult — the largest settlement of its kind. Care.com settled for $8 million on a similar theory in the same year.5
The research on who absorbs the harm is the part that belongs in a conversation about social cost: studies consistently find that dark patterns disproportionately affect people on lower incomes and with lower levels of formal education. The manipulation is not distributed evenly. It lands on the people least equipped to spend twenty minutes finding the cancellation link.
For a small business, this matters in a specific way. The tactics are cheap, available in every page builder, and they do lift short-term numbers. They also convert a customer relationship into an adversarial one, and the internet has a long memory for that.
The arithmetic of trust
Set the ethics aside for a moment and the numbers still argue the same direction.
Deloitte's analysis of 30 million user sessions across 37 brands found that a 0.1 second improvement in mobile load time increased retail conversions by 8.4% and average order value by 9.2%.6 One tenth of a second. Now consider that the median site is carrying dozens of unnecessary scripts, uncompressed images, and third-party embeds nobody has audited — each one costing considerably more than a tenth of a second.
The inverse of that finding is the honest way to read it. If a tenth of a second is worth 8% of conversions, then a site that is two seconds slower than it should be is not slightly underperforming. It is operating with a permanent, invisible discount applied to every marketing pound you spend driving traffic to it.
And unlike an advertising budget, nobody reviews it quarterly.
How to tell, early
You do not need an audit to get a reasonable read. Five questions will do it.
Can a non-technical colleague publish a new page today, unaided, that looks correct? If not, every future change has a specialist attached to it.
How many different button styles does your site have? Count them. More than two usually means there is no system, only accumulated decisions.
When did someone last open the site on a mid-range Android phone on mobile data? Not a flagship on office wifi. That is where a meaningful share of your visitors live.
Can you use your own navigation and submit your own contact form using only the keyboard? This takes ninety seconds and finds a surprising proportion of the errors in the WebAIM data.
What is your slowest page, and when did you last look? Most organisations cannot answer this, which is itself the answer.
None of these require budget. All of them tell you whether you are carrying debt.
The part worth remembering
Good web development is not more expensive than bad web development. It is expensive earlier, and cheaper for the following four years — which is a much less appealing sentence, and the reason the industry keeps producing sites that need replacing.
The three ledgers eventually converge. The rebuild you pay for, the debt you inherit, and the people you excluded are not separate problems. They are the same decision, showing up at different times and on different desks. The businesses that avoid all three tend not to be the ones that spent the most. They are the ones that insisted, early and unglamorously, on being built properly.
Sources
- Consortium for Information & Software Quality (2022). The Cost of Poor Software Quality in the US: A 2022 Report. https://www.it-cisq.org/the-cost-of-poor-quality-software-in-the-us-a-2022-report/
- WebAIM (2026). The WebAIM Million: An annual accessibility analysis of the top 1,000,000 home pages. Utah State University. https://webaim.org/projects/million/
- Seyfarth Shaw, ADA Title III (2026). Federal court website accessibility lawsuit filings, 2025. https://www.adatitleiii.com/2026/03/federal-court-website-accessibility-lawsuit-filings-bounce-back-in-2025/
- Mathur, A., et al. (2019). Dark Patterns at Scale: Findings from a Crawl of 11K Shopping Websites. Proceedings of the ACM on Human-Computer Interaction. https://arxiv.org/pdf/1907.07032
- Congressional Research Service. What Hides in the Shadows: Deceptive Design of Dark Patterns. https://www.congress.gov/crs-product/IF12246
- Deloitte Digital & Google (2020). Milliseconds Make Millions. https://www.thinkwithgoogle.com/_qs/documents/9757/Milliseconds_Make_Millions_report_hQYAbZJ.pdf